CytoSure® Interpret Software is a powerful and easy-to-use package for the analysis of aCGH data, offering an impressive combination of features that allow you the choice of standardised data analysis (using the Accelerate Workflow) or customised, user-defined data analysis. Additional functionality allows effortless identification of both copy number variation (CNV) and loss of heterozygosity (LOH) when used in conjunction with CytoSure arrays containing single nucleotide polymorphisms (SNPs). CytoSure Interpret Software is exclusively provided with OGT's extensive range of CytoSure aCGH arrays.
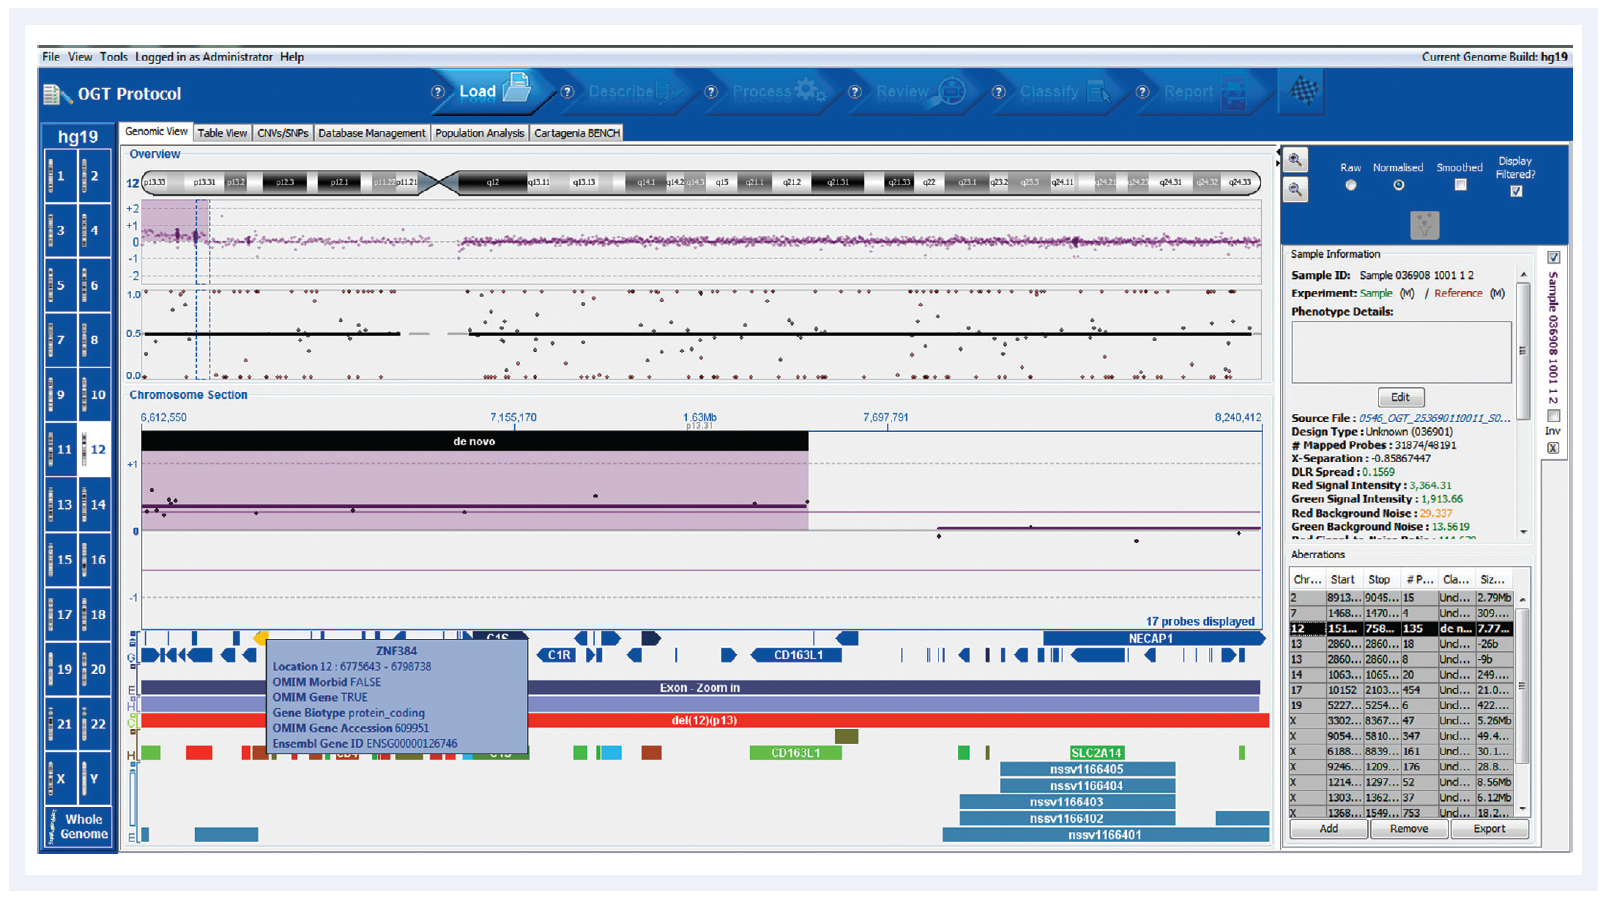
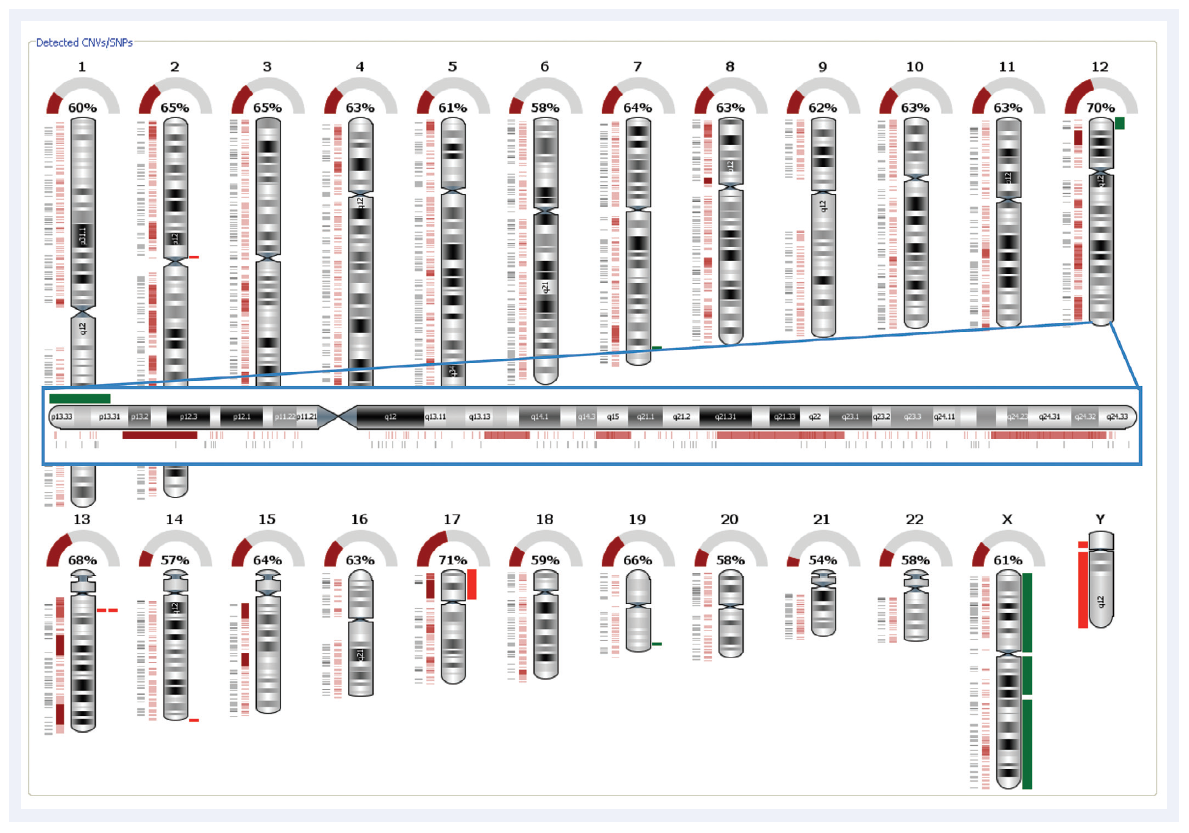
CytoSure Interpret Software utilises an innovative “Accelerate Workflow” that provides automated data analysis based on predefined settings. This unique feature minimises the need for user intervention and maximises the consistency and speed of the data analysis. The analysis time is further reduced by using a batch processing facility, which allows an unlimited number of samples to be analysed simultaneously using the robust, optimised Circular Binary Segmentation (CBS) algorithm for identifying chromosomal abnormalities (Figure 1). The proprietary SNP calling algorithm and associated thresholds enable accurate calling of regions of LOH (Figure 2). In addition, the bulk load feature allows faster sample loading as multiple sets of sample information can be loaded at once as a text file.
Analysis can be performed using arrays designed to hg18 (NCBI36), hg19 (GRCh37) or hg38 (GRCh38) — with easy, one-click switching between builds. The future-proof database structure allows further new builds to be easily imported and existing data re-mapped.

Figure 1: Automated aberration detection with CytoSure Interpret Software, showing clear detection of chromosomal abnormalities. The gain on chromosome 12 for this chronic lymphocytic leukaemia (CLL) sample contains the zinc finger protein gene ZP384, easily identified in the Cancer gene census genes track.


Figure 2: Automated SNP detection and LOH calling with CytoSure Interpret Software. The dark red rectangles indicate regions of LOH. The green and the bright red rectangles indicate amplifications and deletions respectively. This is the same CLL sample as displayed in Figure 1 and clearly illustrates the gain in the telomere region of the p arm and the region of LOH in p13.31-p12.3.

CytoSure Interpret Software includes extensive annotation tracks covering syndromes, genes, exons, CNVs and segmental duplication — each of which link to publicly available databases such as ISCA, Decipher, Database of Genomic Variants and the Cancer Gene Census (Figure 3) providing results in context. Which tracks are displayed is fully customisable allowing only tracks of specific interest to be viewed (e.g. cancer-specific tracks) ensuring easy data interpretation. Each track can reference hg18, hg19 or hg38 information. Annotations within a track can be coloured allowing easy visualisation. It is also possible to customise what information from the tracks is saved in the report (e.g. how many common variants overlap with an aberration). In addition, CytoSure Interpret Software seamlessly integrates with Cartagenia’s BENCH™ software, allowing users to securely transfer CNV calls for aCGH aberration data management and genotype-phenotype correlation, providing greater confidence in the calls made.
The powerful relational database enables storage of sample data according to its relationship with other data. For example, samples can be segregated into different projects by sample type or by user, thereby simplifying analysis as only the data relevant to your work is visible. Annotation of individual samples is defined by the user; custom fields enable information applicable to your samples and experimental setup to be stored within the database. The information contained within these custom fields can then be added to the final report. The database can be accessed simultaneously by multiple users.
Back-ups of the database are straightforward; simply choose a full, partial or mini back up, creating a compressed file which can be reinstated if necessary using the restore function. The installation of the relational database is customisable with a choice of database management systems designed to integrate with your current IT infrastructure. At OGT, we are experts at converting legacy microarray data from a wide range of platforms to a CytoSure Interpret Software compatible format. This ensures seamless transition to OGT without loss of valuable historical data.
The relational database allows flexible data searching utilising “Quick” or “Advanced” search functionality. Advanced search uses Boolean operators to query sample and experimental details as well as aberrations that are stored in the database. The search criteria can be saved allowing searches to be easily repeated.
CytoSure Interpret Software also makes it easy to examine inheritance patterns within related samples using a unique “Family Tree” viewer. Probands can be linked to parents and other family members with the facility to view three generations together.
CytoSure Interpret Software gives you the flexibility to optimise data analysis settings for your laboratory’s specific needs as well as the freedom to customise data reports to show only the information you need. In addition, the permission-based log-on structure enables greater flexibility with respect to management of user accounts. Within an organisation an Administrator can control the access and functionality available to users. This ensures consistency of analysis and reporting and provides an audit trail of any changes made within the software.
CytoSure Interpret Software can be used with the CytoSure Interpret Feature Extraction Module to analyse TIFF images from a variety of commonly available microarray scanners, including NimbleGen, Agilent, Innopsys and Axon (Figure 4). The module comes pre-loaded with template files enabling images to be feature extracted and seamlessly loaded into the Accelerate Workflow without the need for user intervention. The CytoSure Interpret Feature Extraction Module will also automatically search for TIFF images as they are generated, making it possible to start scanning, walk away and return to fully analysed data — a perfect fit to scanning at the end of the working day and interpreting results the following morning. Alerts can be set to ensure that only good quality images are analysed, informing the user of any images that may need to be visually inspected. As well as streamlining the analysis workflow and reducing hands-on time loading and transferring data, the CytoSure Interpret Feature Extraction Module is agnostic regarding the source of TIFF images. It is also possible to scan a high-resolution microarray with a small feature size (i.e. 30 μm) at a low resolution (5 μm), widening the array choice for users with 5 μm scanners.


I recently integrated the new CytoSure Interpret Software into my laboratory workflow. I have been extremely impressed with the ease-of-use and flexibility of the software. In our experience, OGT is very responsive to customer feedback and they have already implemented several of our suggested improvements. OGT has indeed produced an excellent software package that should become a useful tool for cytogeneticists and molecular geneticists.
Dr Agne Liedén
Department of Molecular Medicine and Surgery, Karolinska Institutet, Sweden


